
The Overall Population
The United States currently has a population of around 329 million. This is the estimate for 2019, and we will have an updated number by the end of 2020 as this is a year when the government conducts it Decennial Census.
The census is a count of everyone living in the United States – this has happened since 1790 which gives us really great data around how the population has developed over time. Teams of “census takers” go door to door all across the United States and ask people a series that give us information on number of people, where they’re from, what languages they speak, how old each person is, how much money they earn, and many other questions.

Being able to look at the data over time allows us to see patterns and/or changes. Because of this, and from our knowledge of history we can understand the data. We can see how wars have affected the growth of population at specific time in the history of the United States.
Important information we learn from the census includes some great facts like:
- 21% of people in the United States have a mother tongue other than English
- 24% of the population is under 18 years of age
- 13% of the population are over 65 years of age
- 50.8% of the population is female while 49.2% is male
US Population Pyramid by Age & Gender

Trends by State
The census data also allows us to study the population at different levels. Data is available by state, country, city and even down to the census tract level. I have gathered the population data by state and built some fun and interactive visualization of that data. For most of my visualization work, I use Tableau Public, a free tool that everyone can download and use.
At the time of the first U.S, Census in 1790, there were only 18 states. Below is a map of those states and their percentage of the overall population of the United States. Virginia was the most populous state and had over 17% of the total population !
% of Total Population by State in 1790

The center of population at that time was 23 miles east of Baltimore, Maryland. The following map shows us how that center of population has moved over time. The current center is in Wright County, Missouri.
U.S. Center of Population 1790-2020

The center of population is not the only indicator of population movement that we can clearly see in the data. Since around 1940, there has been a significant movement of the U.S. population to the South and West. States like Florida, Texas and California have seen large increases in their population during that time span. The chart below shows a clear steeping of the growth to those three states. The red, dotted reference line shows the year 1940.

Data Visualization
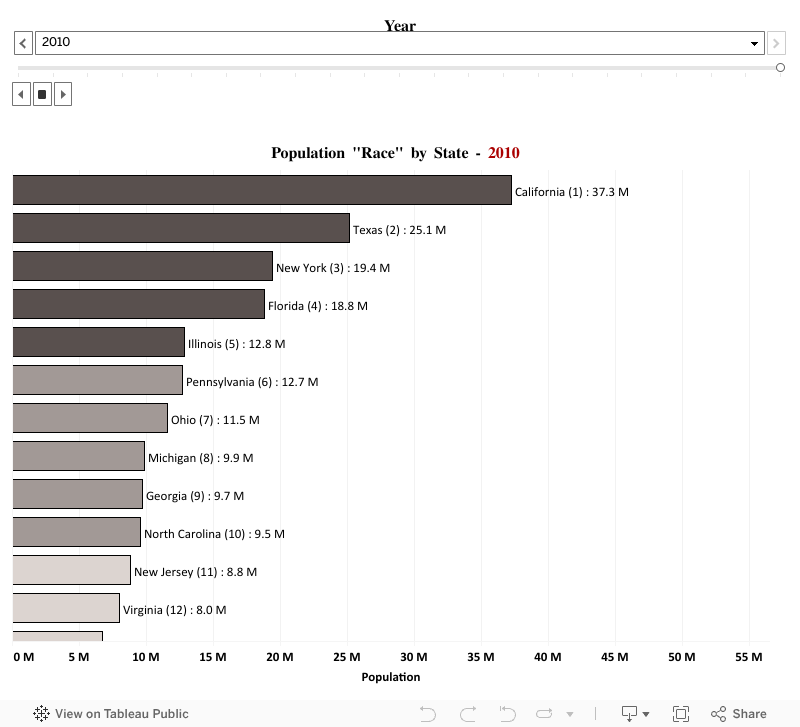
Finally, let’s look at how the states ranked in terms of population over time. This visualization uses new animation features in the Tableau software. Click on the play button to watch how the state populations rank over the 220 years of data we have !


Add comment